3 App Analytics Reports to Help You Understand Your App Conversion Efforts
This five part blog series shares our favorite analytics reports and how they can help you drive better decisions at five key stages of the customer journey from acquisition, to re-engagement. Use these reports to go beyond typical metrics — like daily active users, return visits and more — to learn insights that help you take retarget users and take action in the areas that matter most to your business.
To drive growth, marketers need to foster deeper relationships with customers and grow brand engagement. And, to do so, better customer intelligence is needed to understand, predict and more quickly take action on customer journeys across any digital property or marketing channel.
But what metrics or reports do you need to see those impacts? We’ve created lots of pre-built reports in our data and analytics solution to help the world’s leading brands get more out of their reporting.
We’ve covered how to prioritize your spend and identify your best app acquisition sources and track your onboarding efforts. But some of the most important performance metrics to track relate to conversion.
In this post, we share three reports that can help you better evaluate your app conversion efforts and analyze your campaign efforts.
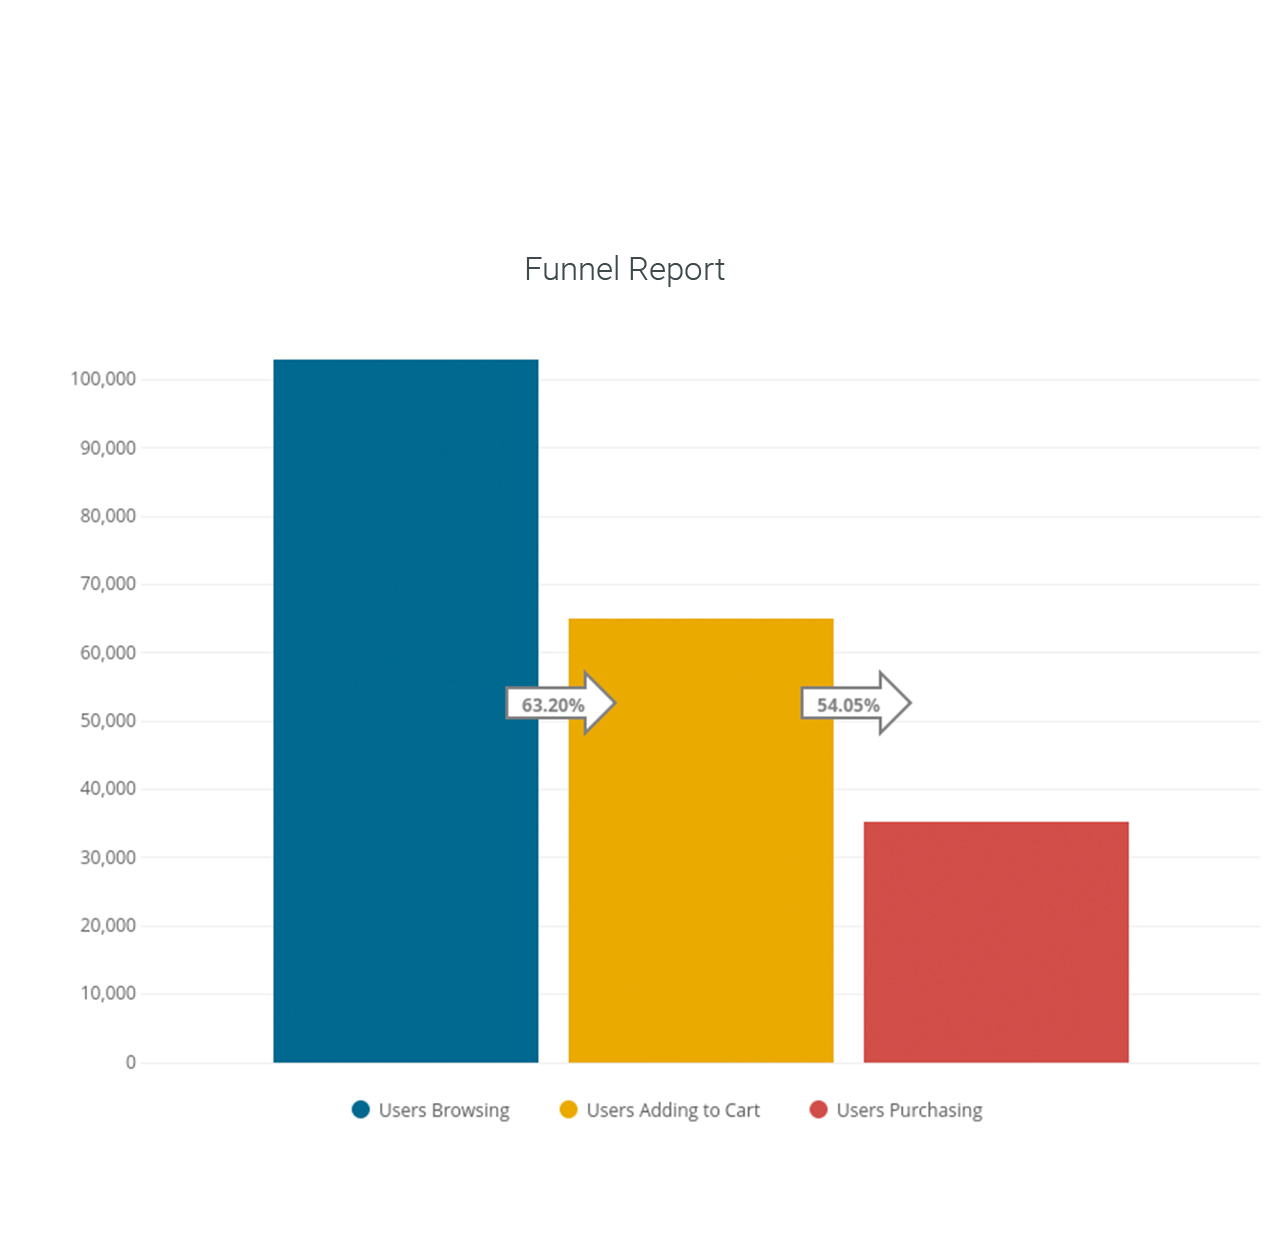
Funnel Report
Funnel reporting is an important view into any app or website’s performance. In addition to determining your conversion rate, it can be a rich source of high-intent users who didn’t quite make it “over the hump” to convert. Drilling down into user-level activity shows steps prior to conversion to identify where users are dropping off and, more importantly, allow you to reach them in retargeting efforts, capturing lost revenue visitors with high-intent to buy.
Key questions this report can answer:
-
Which buyers are most likely to purchase but haven’t yet?
-
Which buyers showed interest in a specific offer or product but haven’t purchased?
-
Where am I losing visitors in my conversion funnel?
Resulting Actions:
-
Identify high-intent users for retargeting and run campaigns to bring them back.
-
Determine which step(s) in your conversion process to optimize, allowing you to focus on high-value tasks.
-
Experiment with creating different types of offers to move users toward conversion.
Identify and retarget users who abandoned their shopping carts, easily pulling the list to reach them from the report.
Footfall Traffic Report
Our Footfall Traffic Report correlates analytics between messages sent and geofence/beacon location data so you can see how effective your notifications are at creating footfall traffic in key stores and locations. Easily measure the impact a notification has on that traffic within the last hour and offline behavior. You can also determine how long your users are spending in a location like a storefront or aisle to measure in-store engagement.
Key questions this report can answer:
-
Is my digital messaging driving in-store footfall?
-
Which stores and departments are my customers visiting? At what times of the year?
-
How are certain types of messaging impacting individual store or department traffic?
Resulting Actions:
Utilize correlated messaging and footfall data to increase urgency with holiday promotions.
-
Experiment with messaging campaigns to drive traffic at locations similar to those that have achieved increased traffic due to notifications.
-
Put additional successful messaging campaigns in place to drive foot traffic, especially in higher yield departments.
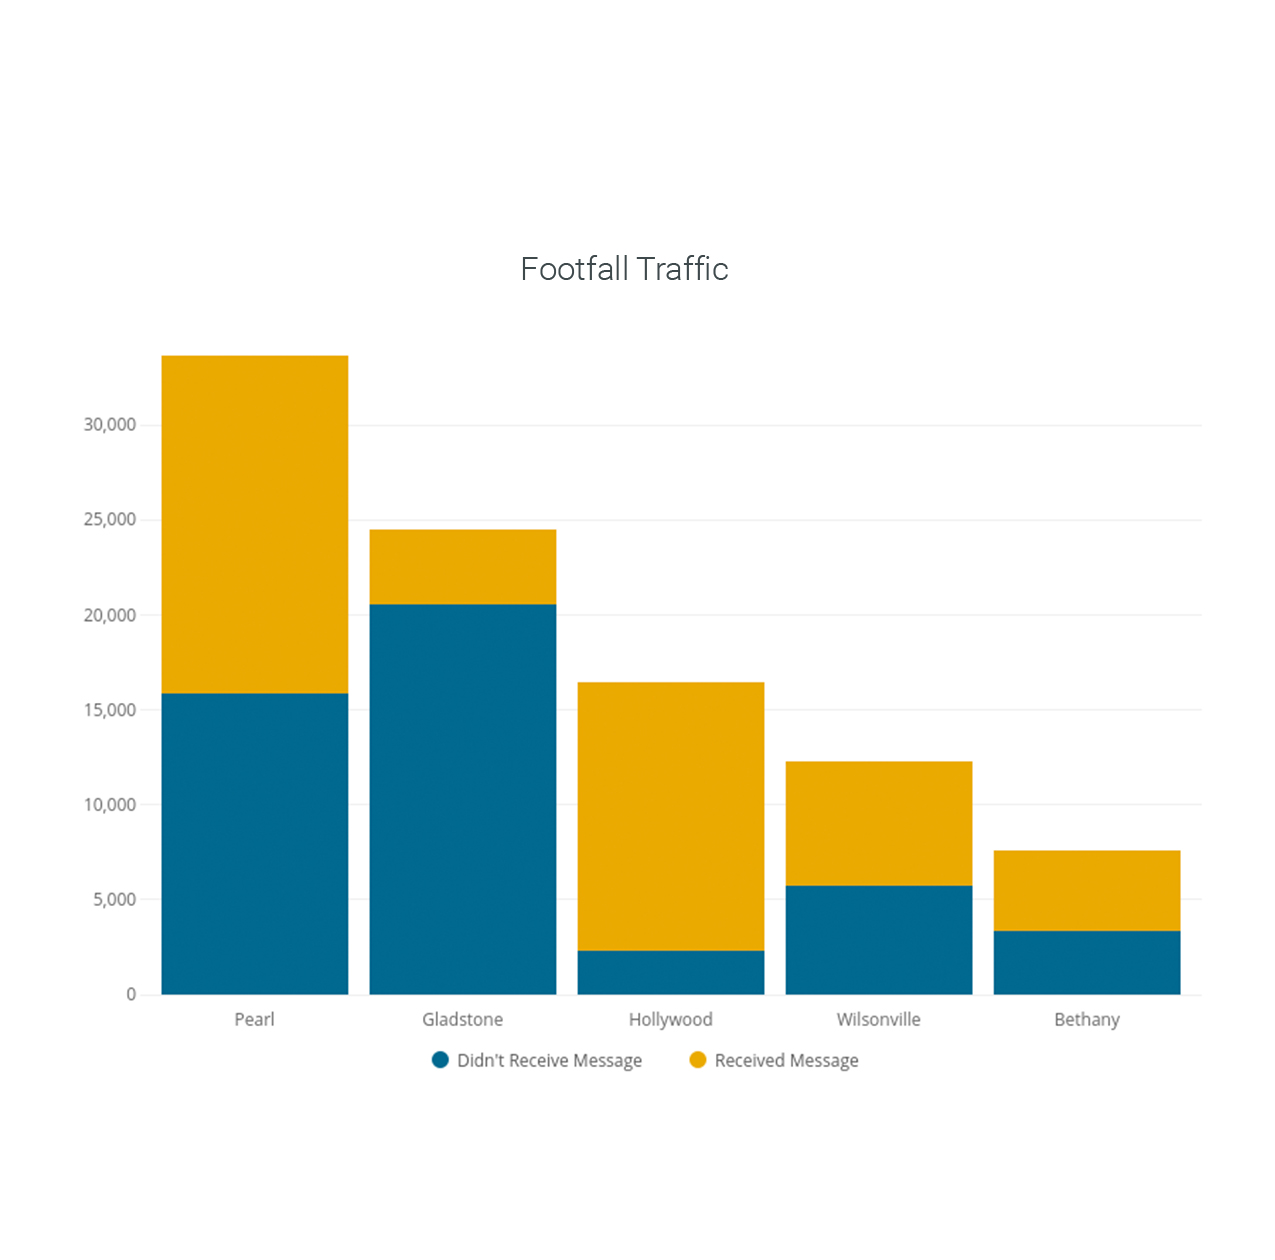
Easily show the correlation between notifications sent and footfall traffic at target locations using this report.
Campaign Drill Down Report
Get a telescopic view into campaign performance for precise reporting. Most campaign reporting solutions provide one or two dimensions of detail, like campaign name and channel. The Campaign Drill Down Report allows you to define up to 10 dimensional attributes like campaign type, channel, content type, promotion, offer, etc. that are most critical to your business. Measure and evaluate app, website, email and SMS campaign performance by the view that matters most to you.
Key questions this report can answer:
-
Which campaigns are driving the highest customer engagement and conversion?
-
Which channels or offers within a campaign are performing?
-
Are certain types of campaigns, products or offers more suited for a particular channel than another?
Resulting Actions:
-
Run more of the campaigns performing best and less of those that are not performing.
-
Make adjustments to tactics (promotional messaging in particular) to increase engagement.
-
Adjust your mix of channels, campaign types and offers to maximize for conversion or LTV.
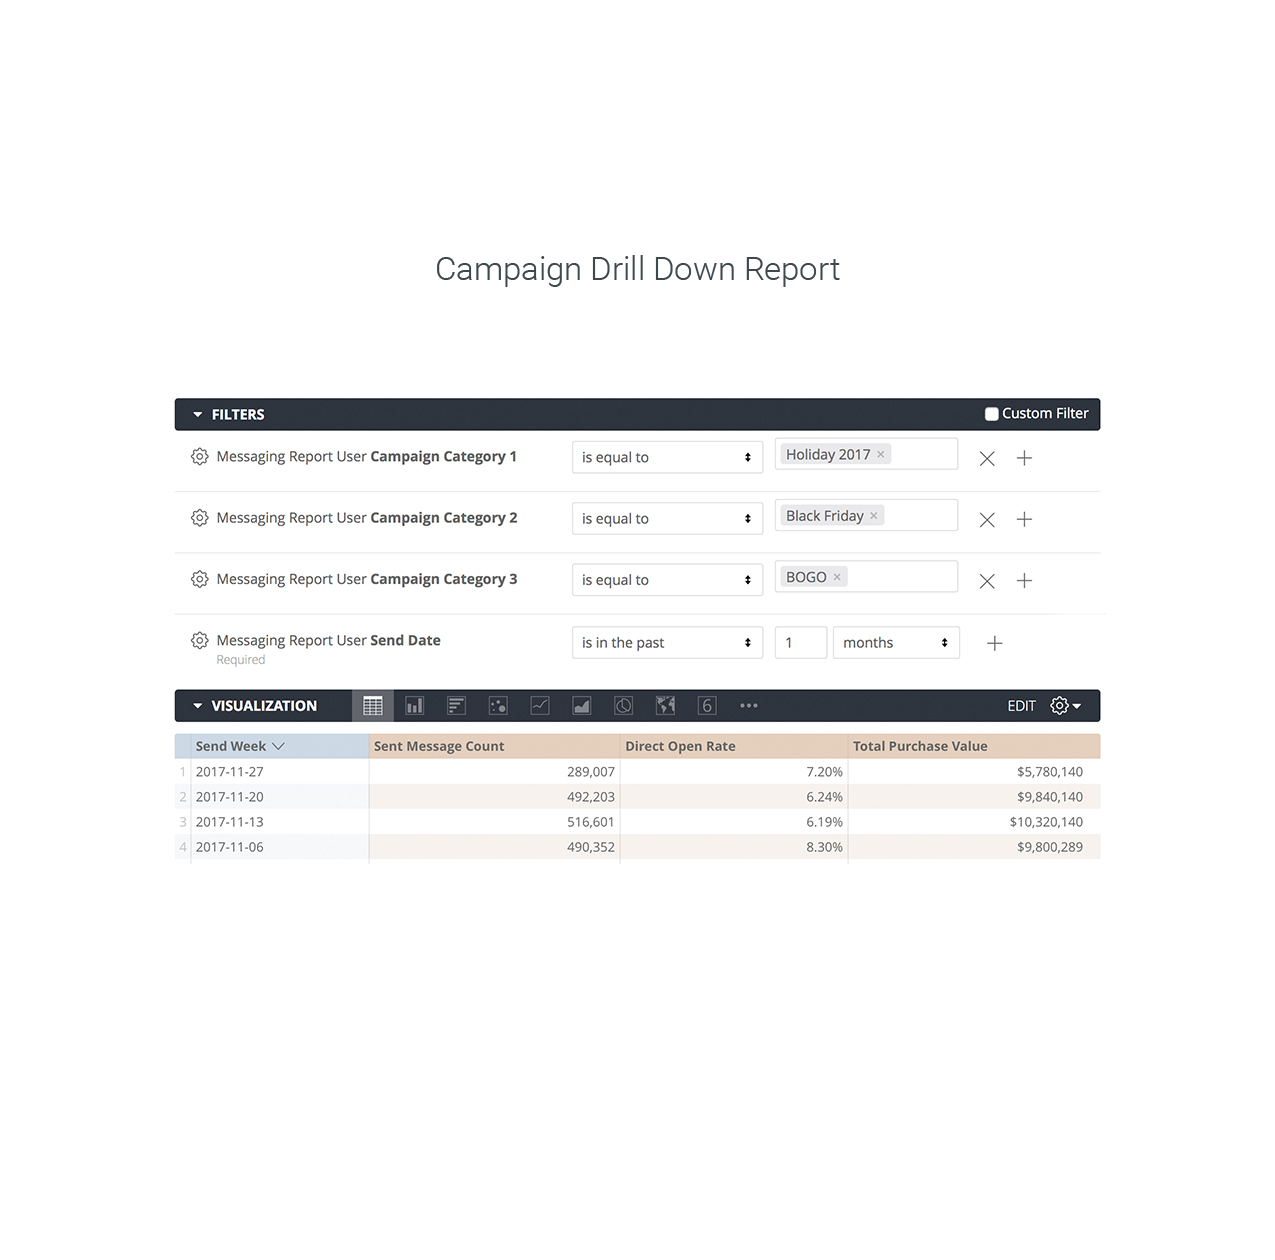
Add filters to campaign reports to demonstrate the impact of various campaigns or offers.
Interested in reports beyond that help you beyond tracking and monitoring your conversion efforts? Our 11 Must-Have Predictive Lifecycle Marketing Reports eBook shares additional predictive lifecycle marketing reports we recommend you start tracking to drive better decisions at key stages of the customer journey.
Next up in our series, we’ll discuss 2 reports that can help you gauge your retention efforts. Subscribe to our blog to follow along – we share a weekly digest so you don’t miss a thing.
Want to see all of the reports we’ll be covering in this series right now? Download our eBook 11 Must-Have Predictive Lifecycle Marketing Reports anytime!
Subscribe for updates
If the form doesn't render correctly, kindly disable the ad blocker on your browser and refresh the page.
Submit
Related Posts